Importance of CPI or what metrics developers are looking at

Game Development
4 years ago
Most game development companies consider themselves to be completely user-centric. But, unfortunately, indicators are not always oriented to the audience. Developers who want to become user-centric and grow faster must measure what they themselves are doing for these users.
All users have concerns, needs, questions, or desired expectations about how quickly and easily they can be reached. To measure this, you need to enter CPI metrics (Customer Performance Indicators, that is, performance assessments from the user's point of view).
Many development companies can become more focused by implementing, measuring and optimizing CPI. And since users are the only possible source of growth, the level of these indicators can be the best way to accelerate growth (as well as predict it).
CPI - user metric
CPI is a metric that helps determine the direction for the development of the project, so its control is very important.
Low CPI - less than 20 cents for the US market. For developers, this is a signal to take action to attract users.
High CPI - above 60 cents. But the bottom line is that if you attract a solvent audience, then even $ 2.5-3 is normal. But there are exception projects that have good retention, but low playtime, a rating below two stars and a high CPI. These are good metrics for integrations, so that in the future the game will bring a decent income.
It also happens that part of the audience is “burned out”, but solvent ones come. And you can still work with this. In any case, CPI is not what we look at first.
Pay attention to retention
Retention is good - try to buy at any CPI.
For example: Day 1 retention (R1) is 45%+, R3 25%+, and R7 13%+ and then CPI is not important at all. Then there is a chance to attract players and reach payback.
Retention types:
Level 1. Top: R1 45%, R3 25%, R7 13%, R30 4%.
An example is WormsZone.io, where LTV is initially low, but the retention of the game is high and long. As a result, after the game has 300 million installs and it still brings good money.
Level 2. Good: R1 40%, R3 15%, R7 9%, R30 2%.
An example is Bottle Jump and Harvest. After the work done on the game to track the level of winrate and levels, users began to spend more time in the game and increased the number of installations.
Level 3. Borderline: R1 35%, R3 12%, R7 7%, R30 1%.
Do Not Fall is an example of a border game. But working on the funnel of levels and balance also allowed us to correct the situation.
Level 4. Below average.
If R1 is, say, 30%, then you need to look at R3 and R7, how fast they fall. If they don’t fall very quickly, and something remains there, then in general it makes sense to refine something and try to buy on other advertising networks. The example of Bike Hop in the early days is quite low retention, but it does not fall so quickly and the game pays off due to a fairly low CPI.
Don't forget to keep track of your sales funnel and number of active users to help you learn about retention. Also do not forget to look at the opening of skins!
Rate Me: A Different Way to Understand Your Partner
Outflows and their solutions
Let's take a situation: good CPI, but low retention. Then we look at what could be the problem and try to fix it with several iterations.
To increase your retention rate, you need to understand why customers leave. This can be done in several ways.
1. Collect feedback - ask what customers do not like, at what stage of interaction with the company they encounter problems.
2. Test hypotheses using marketing mechanics. For example, a store wants to test the hypothesis that customers are not returning due to high prices and launches a mailing list with a selection of discounted products. If customer churn decreases, the hypothesis is confirmed.
The main reasons for churn and their solutions:
| Cause | Solution |
|---|---|
| The client does not understand the value of the product, does not know about some of the features or does not know how to work with the product | Create instructions, guides, and videos that explain the value of the product. Simplify the setup process |
| The company does not keep in touch with the customer after the sale | Maintain a relationship with the client after the sale: ask to evaluate the service, send newsletters about promotions, invite to events and webinars, introduce a loyalty program |
| Poor service: Customer support requests are ignored, customers wait a long time for an answer to questions, employees communicate incompetently, impolitely or indifferently, do not help customers | Hire more support staff, train and motivate them. Organize a system for distributing requests, in which requests will be received by the specialist who can quickly solve this particular problem |
| Difficult user experience: it is not clear how to find the desired section or button on the site, you have to perform too many actions to place an order, your eyes get tired of the bright interface design, there are too many elements on the site | Analyze the user's journey in the product and highlight the main UX problems they face. Improve UX design, make the interface intuitive |
| Customer complaints are ignored, negative reviews are removed from the company's social networks | Respond to negative reviews as quickly as possible - deal with the problem, politely apologize and thank the client, give gifts. Notify the customer that the issue has been resolved |
It is very important to track all the metrics and keep in touch with the user, especially now - the competition is big and there are a lot of similar games. But you need to fix bugs quickly so that the audience does not have time to burn out.
Retention rate (RR) — customer retention rate.
This ratio shows how well the company builds long-term relationships with customers.
A high RR means that customers often return for repeat purchases or renew their subscription, while a low RR means that most customers churn.
The company's profit directly depends on how it works with new and regular customers. The likelihood of selling to an existing customer is much higher than selling to a new one.
It turns out that building long-term relationships with existing customers is more profitable than constantly looking for new ones. Loyal customers already know the product and tell family and friends about their favorite brand. While attracting a new client still needs to spend money, effort and time.
The retention rate helps to assess whether a company is able to build relationships with its customers or not.
For example, developers sometimes restart loyalty programs and launch cashback. They encourage you to save and spend points with the help of promotions and a personal account.
As a result, the annual retention rate increased significantly. The share of revenue from mailings has doubled relative to the total revenue of online and offline stores.
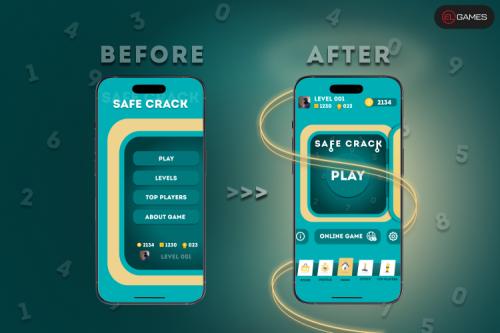
Changing the icon - the best way to convert for the install
How to calculate retention rate
The retention rate shows the ratio of users who returned for repeat purchases to the number of customers at the beginning of the billing period. To calculate the retention rate, you need to know the amount:
-clients at the beginning of the billing period - S;
-customers at the end of the period — E;
-new clients for the period - N.
Calculation formula
.png)
So, to calculate the retention rate for a month, you need to subtract the number of new customers from the total number of customers who made a purchase during that month. This is done in order not to take into account new customers - they do not compensate for the outflow.
For example, the calculation of RR in the PullRice game for a month:
-100 clients at the beginning of the month;
-40 new clients per month;
-20 out of 100 existing customers haven't bought anything in a month.
E = 100 + 40 − 20 = 120 - total customers at the end of the month.
RR = (120 − 40) ÷ 100 × 100% = 80%.
Usually RR is calculated for a year, half a year, a month or a week. The period depends on several factors: the deal cycle, how often people buy the product, how fast the company is growing, and what the business model is.
Metrics related to retention rate
Retention rate is closely related to other metrics - churn rate, NPS, repeat purchase rate, LTV.
If you add the churn rate and the retention rate, you get 100%.
To calculate the churn rate, you will need:
-number of clients at the beginning of the month - S;
- number of customers at the end of the month - K.
Churn rate = (S − K) ÷ S × 100%
NPS - consumer loyalty index
NPS is directly related to RR because only satisfied customers return for repeat purchases. If NPS is more than 80%, then all the surveyed customers are satisfied and will recommend the company to their friends, therefore, a high RR can be expected.
To determine the NPS, after the purchase, the company contacts the customer and asks: “What is the probability that you will recommend us to your friends?”. The client chooses an answer on a scale from 1 to 10, where 1 means I will never recommend, and 10 means I will definitely recommend. The result is a scale from -100 to 100: at one end of the spectrum are those customers who gave a rating of 6 and below, at the other - from 9 to 10. In the middle of the spectrum are those who gave a rating of 7, that is, they are brand neutral .
If 10% of respondents are critics, 20% are neutral, and 70% are fans, then the company's NPS will be 60 (70 − 10 = 60).
Repeat purchase rate - frequency of repeat purchases
The metric is similar to RR and also shows the percentage of customers who made more than one purchase in a period. The difference is that these indicators are used in different situations.
Each industry has its own average RPR because it depends on the product. For example, a company with durable goods (cars) will have fewer repeat purchases than a company with FMCG (cosmetics or clothing).
On average, a repeat purchase rate of 20 to 40% is considered a good indicator.
Lifetime value - the life value of the client
Shows how much profit the client brings for the entire time of interaction with the company. If RR shows how many customers the company retains, then LTV shows exactly which customers need to be retained.
You can compare how much the store spends on attracting and retaining customers with how much profit they bring. An acceptable ratio of LTV and cost of customer acquisition, at which the business develops and makes a profit, is considered to be 3 to 1. If the client brings the company three times more money than the company invests in it, then the marketing efforts pay off.
In some situations, the acquisition cost may be higher than LTV, and the company will still be in the black.
Key points about metrics
Metrics help you keep track of what kind of relationship developers have with current users. The better the relationship, the more often customers make purchases and the greater the profit.
Retention rate is related to other metrics - NPS, churn rate, repeat purchase rate and LTV.
It is possible to increase the retention rate if you understand what exactly users do not like. To do this, it is necessary to conduct research of the target audience, surveys, in-depth interviews. Then, based on the data obtained, it is necessary to formulate hypotheses about how to improve the customer experience and how this may affect RR, and test these hypotheses using marketing mechanics.